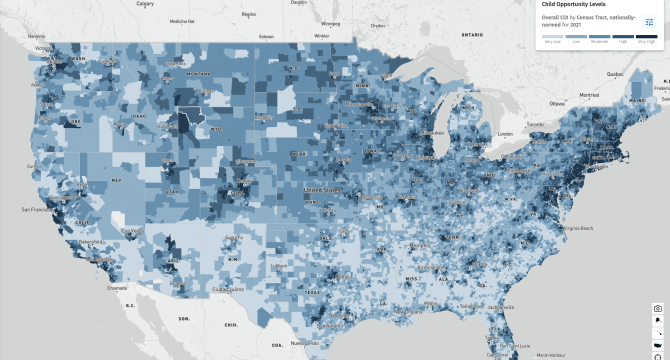
Neighborhoods matter. Children who live in neighborhoods with quality schools, safe housing, access to healthy food, parks, clean air and economic opportunities air are more likely to grow into healthy, productive adults than children who do not have access to these resources. The Child Opportunity Index (COI) measures and maps the quality of resources and conditions like these that matter for children's healthy development in the neighborhoods where they live.
The COI is a composite index of children's neighborhood opportunity that contains data for every neighborhood (census tract) in the United States from every year for 2012 through 2023. It is comprised of 44 indicators in three domains (education, health and environment, and social and economic) and 14 subdomains.
Underlying all our work is a commitment to equity. We believe all children deserve an equal opportunity to grow and learn. Our core question asks whether all children—regardless of where they live or their race and ethnicity—have a fair chance of experiencing neighborhood conditions that help them thrive. We aim to expand the national discourse on inequality to encompass not only income and wealth but also the neighborhood environments where children grow up.
Developed in 2014 in collaboration with the Kirwan Institute for the Study of Race and Ethnicity at Ohio State University, the COI has been widely used to spark discussions on unequal access to opportunity and to spur policies, programs and actions that advance racial/ethnic equity.
COI 3.0-2023, launched in 2025, is the latest release of the index.

Report
First findings from the Child Opportunity Index 3.0 reveal substantial inequities in neighborhood opportunity across and within the 100 largest metro areas. Discover what we're learning and why it matters for the health and wellbeing of our children and society.

Report
Our COI 3.0 technical documentation provides an in-depth look at the methodology, sourcing, descriptive statistics and validation analyses behind the index.
Interactive map
What does child opportunity look like in your community?
Use our interactive mapping platform to explore child opportunity in your community, state or across the entire nation. Overlays with child population data by race/ethnicity display inequities within metro areas.
Find your neighborhoodDataset
COI 3.0-2023 is based on 44 component indicators spanning three domains (education, health and environment, and social and economic). Data is available for virtually all U.S. census tracts (2010 definition) from 2012 to 2023. Download COI 3.0-2023 data for the overall index, its domains and subdomains.
Download now
Blog
A high-level overview of the differences between COI 3.0 and previous versions: new indicators, updated methodology, stronger predictive validity and more.

Research brief
With new releases of the COI, we include additional years of data, review current and novel data sources, follow the rapidly evolving scientific research base and explore new technologies. The Release Notes detail technical changes in each successive release and version.

Data visualization
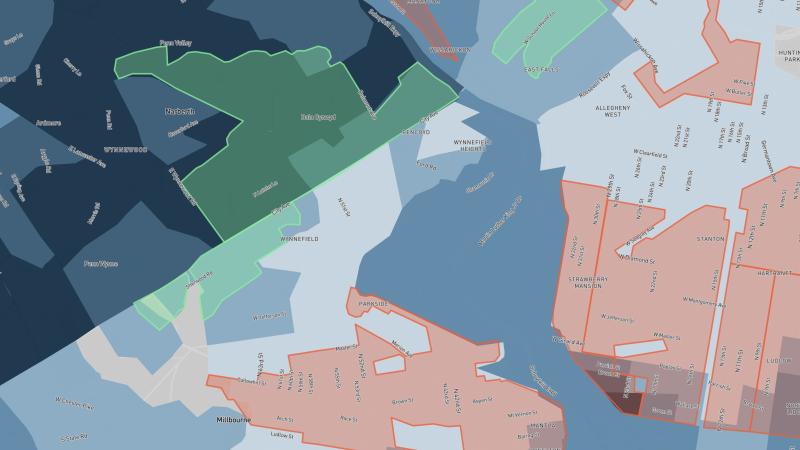
Neighborhood opportunity varies widely across—and within—metro areas. See Child Opportunity Scores and Levels for the 100 largest metro areas.
Data visualization
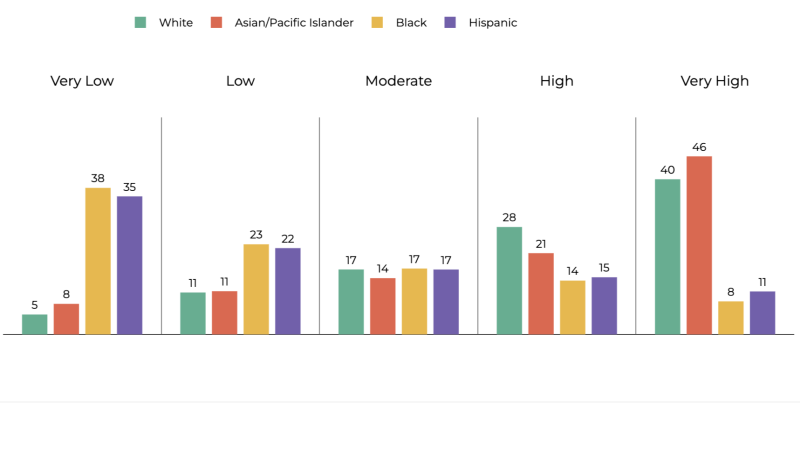
The Child Opportunity Index 3.0 reveals the extent to which Black and Hispanic children are concentrated in lower opportunity neighborhoods.

Data visualization
Neighborhoods have lifelong impacts. The COI 3.0 shows how life expectancy and adult socioeconomic mobility vary considerably between very low- and very-high opportunity neighborhoods.

Research
More than 200 peer-reviewed papers have used the Child Opportunity Index to explore how neighborhood opportunity relates to health, housing, early childhood and more.

Blog
Curious about Child Opportunity Levels? Scores? Racial/ethnic Gaps? Here are our terms, defined.
Equity tool
We present the only dataset available that maps child opportunity today to “redlining,” the 1930s neighborhood risk grades assigned by the Home Owners’ Loan Corporation (HOLC).
Impact story
Michigan’s public preschool program uses the Child Opportunity Index to target services toward children in low-opportunity neighborhoods.

Impact story
SNO Mass helps families with children who are eligible for Housing Choice Vouchers move to neighborhoods in designated “opportunity areas,” as defined by the Child Opportunity Index.

Blog
What users of Child Opportunity Index ZIP code estimates should know about their strengths and weaknesses.