The Child Opportunity Index (COI) 3.0 measures and maps the quality of neighborhood resources and conditions that matter for healthy child development. For example, what percentage of young adults in the neighborhood graduate high school and attend college? What about the overall air quality, access to green space, presence of vacant housing or the likelihood of having broadband internet at home? How many adults are employed in high-skill jobs and how high are household incomes? The COI includes 44 key factors like these in three domains: education, health and environment, and social and economic.
The Child Opportunity Index is the first index of neighborhood conditions that focuses specifically on the neighborhood features that help children thrive. Our accompanying report The State of Racial/Ethnic Equity in Children's Opportunity focuses on neighborhoods in the 100 largest metro areas—cities and their surrounding suburbs—which are home to 68% of U.S. children.
The Child Opportunity Score ranks all neighborhoods in the U.S. on a scale of 1 to 100. For the following visualizations, we computed the Child Opportunity Score experienced by the typical (median) child for each of the 100 largest metro areas.
We see huge variation in neighborhood opportunity across metros. For example, the typical child in the McAllen, TX area lives in a neighborhood with a Child Opportunity Score of 6—the lowest among the 100 largest metros—while the typical child in the Bridgeport, CT area lives in a neighborhood with a score of 88—the highest among the 100 largest metros. These differences indicate that children across the U.S. are growing up in neighborhoods with vastly different conditions and resources for healthy child development.
The geography of opportunity
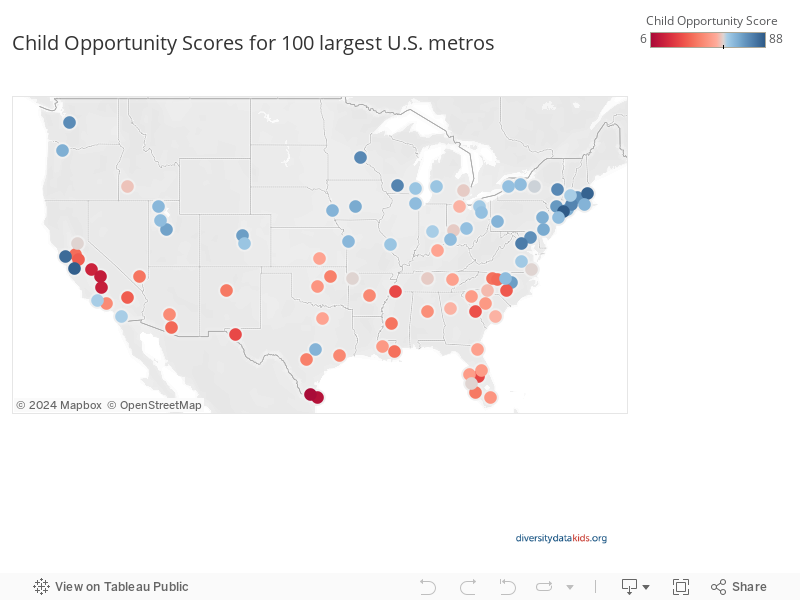
The map below shows the Child Opportunity Score of each of the 100 largest metro areas. The score represents the neighborhood opportunity experienced by the typical (median) child in that metro area. Generally, we see that children experience the lowest levels of neighborhood opportunity in metros in the south, inland California and along the U.S.-Mexico border, and the highest levels of opportunity in the northeast, northern California and the upper midwest.
Hover over a colored dot to see the Child Opportunity Score that the typical child in that metro area experiences.
Where is child opportunity highest?
Children who live in the highest ranked metros enjoy the highest levels of opportunity in the U.S. These children are more likely to have access to many of the conditions they need to live healthy lives and grow into successful adults, while children who live in the lowest ranked metros have much more limited access to the resources they need to thrive.
The chart above ranks the 100 largest metro areas by Child Opportunity Score experienced by the typical (median) child, from the highest to lowest. Hover over a blue bar to see how each metro’s Child Opportunity Score compares to the score for the 100 largest metros combined (58).
Distribution of children across Child Opportunity Levels
Another way to quantify neighborhood opportunity is through Child Opportunity Levels. After ranking all neighborhoods from 1 to 100 by their Child Opportunity Score, we group them into five national Child Opportunity Levels (five equal groups each containing 20% of the U.S. child population): very low-, low-, moderate-, high- and very high-opportunity. A child living in a very low-opportunity neighborhood faces some of the worst neighborhood conditions in the U.S., and conversely, a child living in a very high-opportunity neighborhood experiences some of the most favorable neighborhood conditions.
The chart below shows the distribution of children across the five national Opportunity Levels for each of the 100 largest metro areas. As you scroll down, notice the wide variability in neighborhood opportunity that children experience based on where they live. Metros are currently sorted alphabetically; you can also sort them by percent of children in very low- and in very high-opportunity neighborhoods.
In McAllen, TX, 78% of children live in very low-opportunity neighborhoods, which means that more than three in four of all children in McAllen live in neighborhoods that, by national standards, have the most limited conditions and resources for healthy child development. On the other hand, in San Jose, CA, 61% of children live in very high-opportunity neighborhoods by national standards, enjoying some of the most favorable conditions found nationwide.
In Milwaukee, children live at the extremes—almost a third (30%) live in very low-opportunity neighborhoods by national standards, and 35% live in very high-opportunity neighborhoods. Only 11% of children live in the middle, in moderate-opportunity neighborhoods.
Where children grow up matters
Regardless of where they live, children should have access to resources that allow them to reach their full potential. The neighborhoods in which children grow up strongly influence not only their everyday lives, health and education today, but also their outcomes as adults. Because neighborhoods matter for healthy development, we created the Child Opportunity Index to quantify and compare neighborhood opportunity, establishing a shared knowledge base for action. Policymakers, governments, community organizations, advocates and others can use the COI to understand and improve access to child opportunity, so that all children can enjoy neighborhoods that support healthy development.
Learn more about the Child Opportunity Index 3.0
Explore child opportunity in your metro area
Read our full report: The State of Racial/Ethnic Equity in Children's Neighborhood Opportunity: First Findings from the Child Opportunity Index 3.0