The Child Opportunity Index (COI) measures and maps the quality of resources and conditions (e.g., good early childhood education centers and schools, green spaces, access to healthy food, low poverty) that matter for children to develop in a healthy way in the neighborhoods where they live. The Index looks at 29 key factors that affect how children experience their neighborhoods in three domains: education, health and environment, and social and economic.
The Child Opportunity Index is the first index of neighborhood conditions that specifically focuses on those neighborhood features that help children thrive. The Geography of Child Opportunity report covers all neighborhoods in the 100 largest metro areas—cities and their surrounding suburbs—which are home to 67% of U.S. children. Subsequent reports will include analysis of data for all neighborhoods in the U.S.
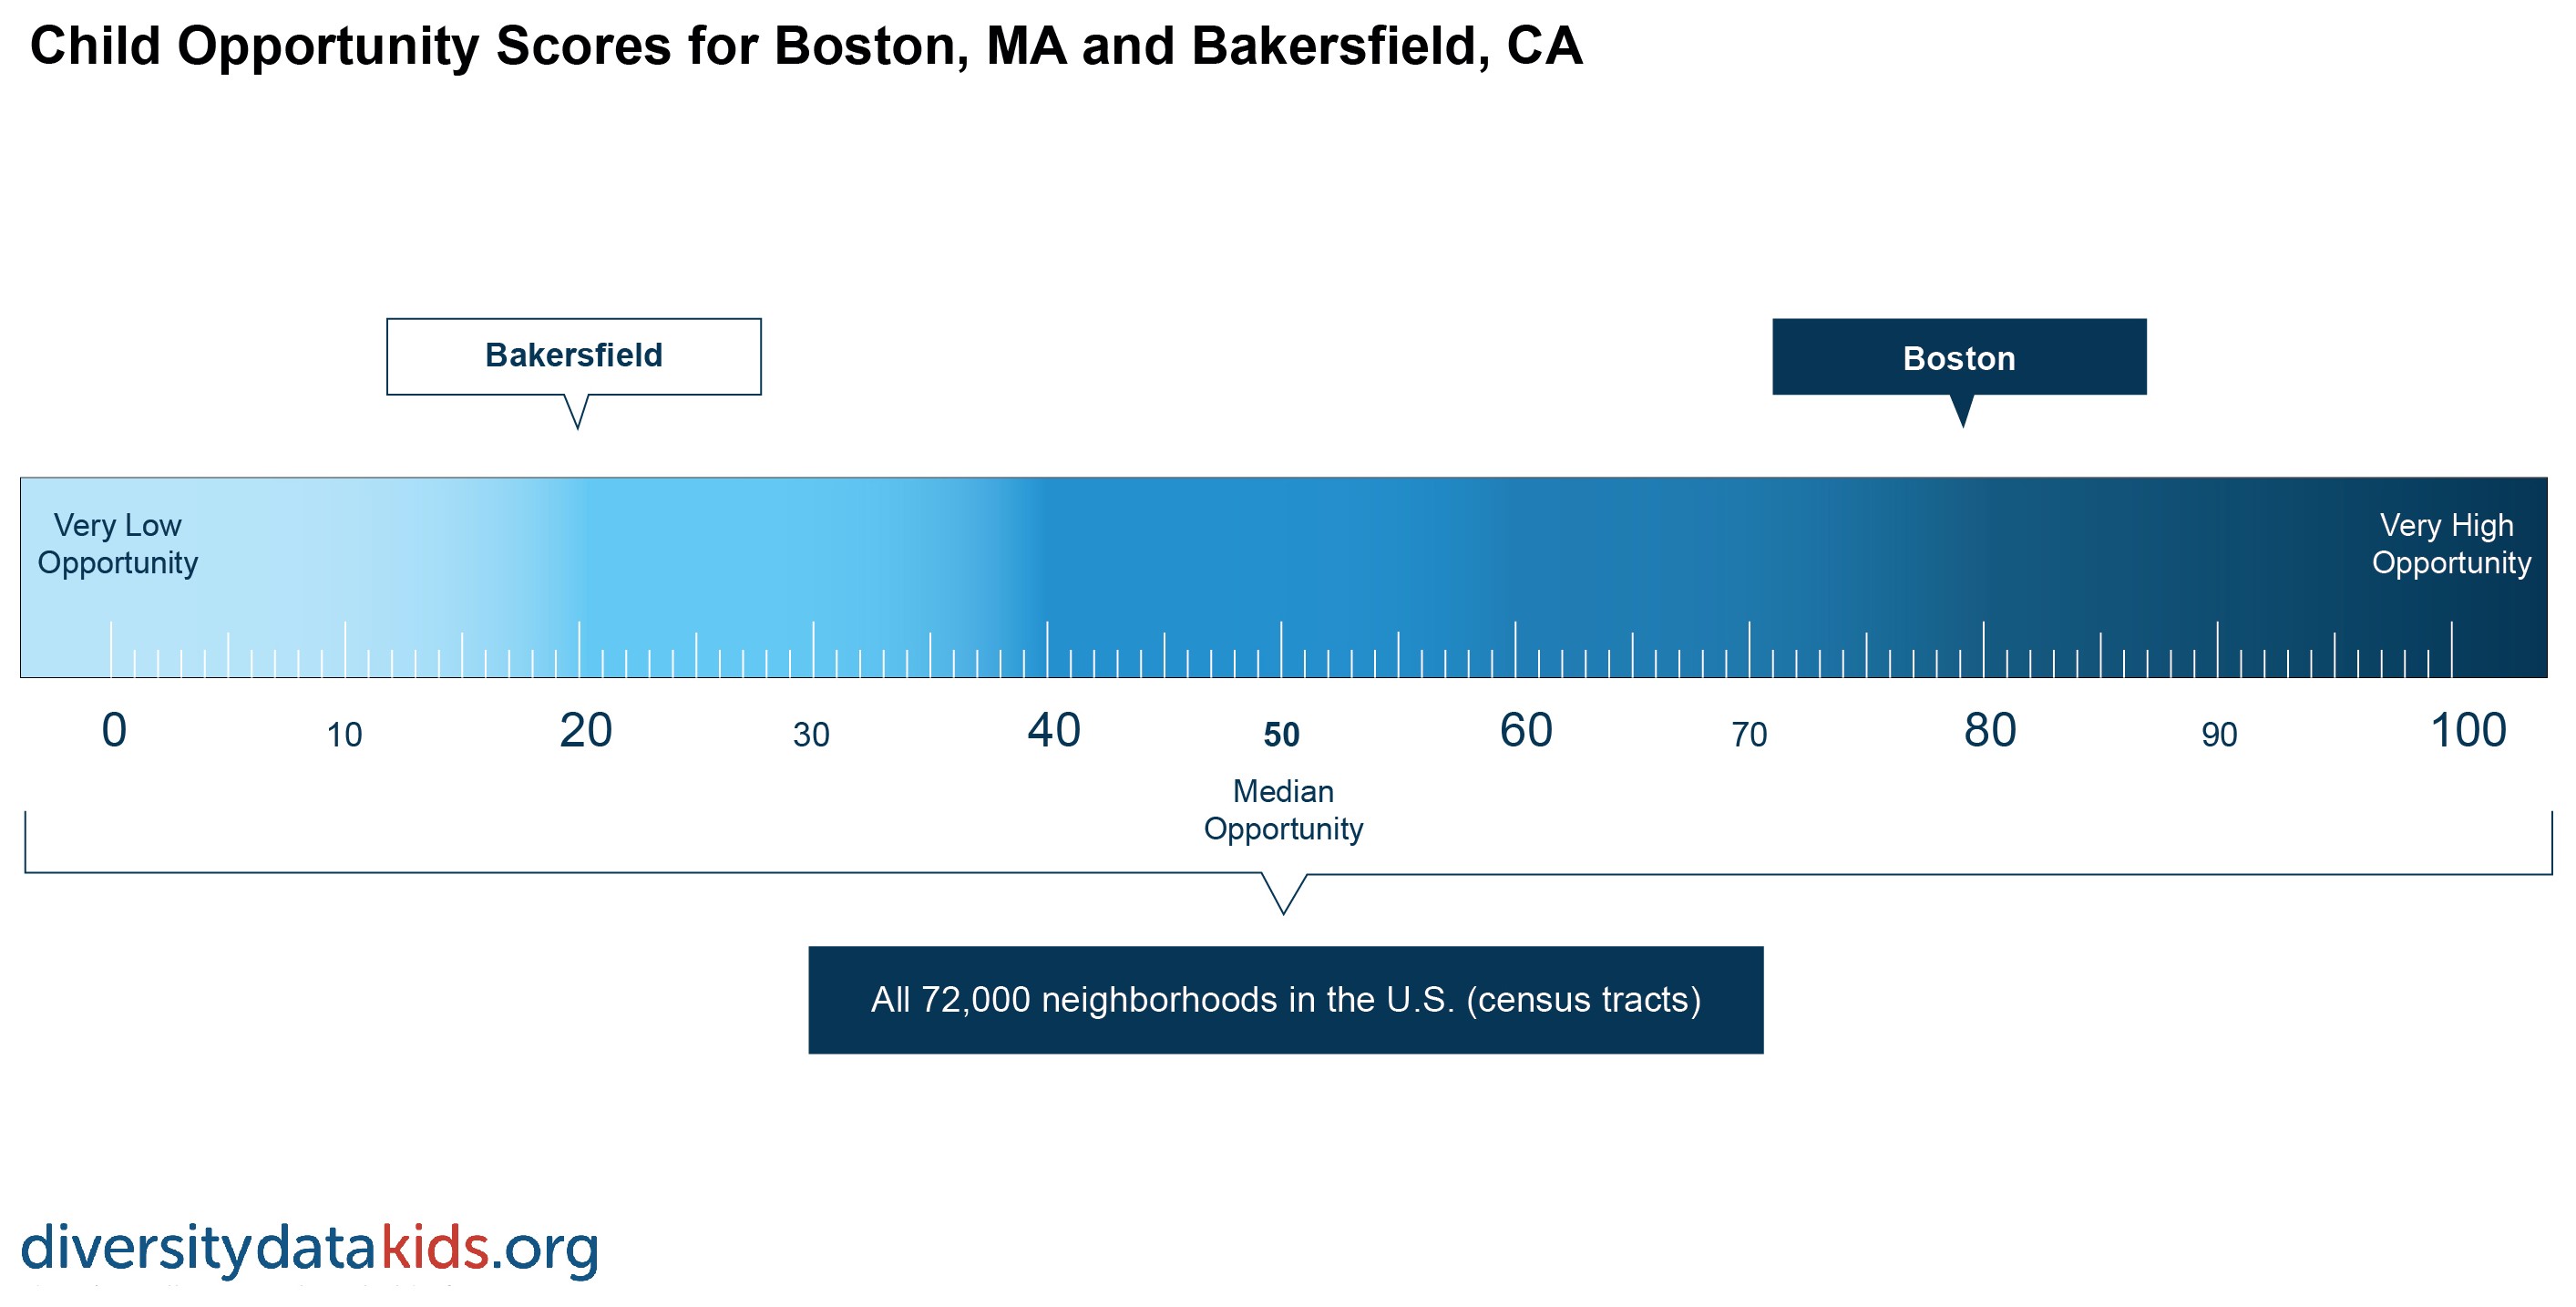
The Child Opportunity Score ranks all neighborhoods in the U.S. according to their Child Opportunity Index on a scale of 1 to 100. The Child Opportunity Score for a given metro area summarizes the neighborhood opportunity experienced by the typical child in that metro and allows us to make comparisons between metro areas. For example, in Bakersfield, California, the Child Opportunity Score is 20, while in Boston, Massachusetts, the score is 79. These differences indicate that children across the U.S. are growing up in neighborhoods with very different conditions and resources for healthy child development.
Learn more: What is child opportunity?
The COI in action: User stories
Read the report: The Geography of Child Opportunity
The geography of opportunity
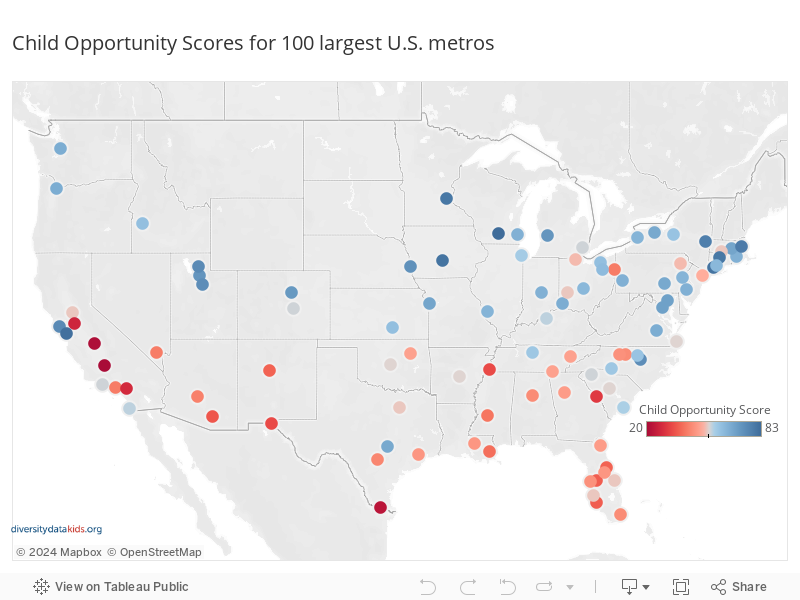
The map below shows the Child Opportunity Score for each of the 100 largest metros—the score represents the neighborhood opportunity experienced by the typical child in that metro area. Children experience the lowest levels of neighborhood opportunity in metros in the South, Southern California and the industrial Midwest, and the highest levels of opportunity in the Northeast, Northern California and the upper Midwest.
Hover over a colored dot to see the Child Opportunity Score that the typical child in that metro experiences.
Where is child opportunity highest?
We rank each metro areas according to their Child Opportunity Score. Overall, children who live in the highest ranked metros enjoy the highest levels of opportunity in the U.S. These children are more likely to have good access to many of the neighborhood conditions that children need to live healthy lives and grow into productive adults, while children who live in the lowest ranked metros have more limited access.
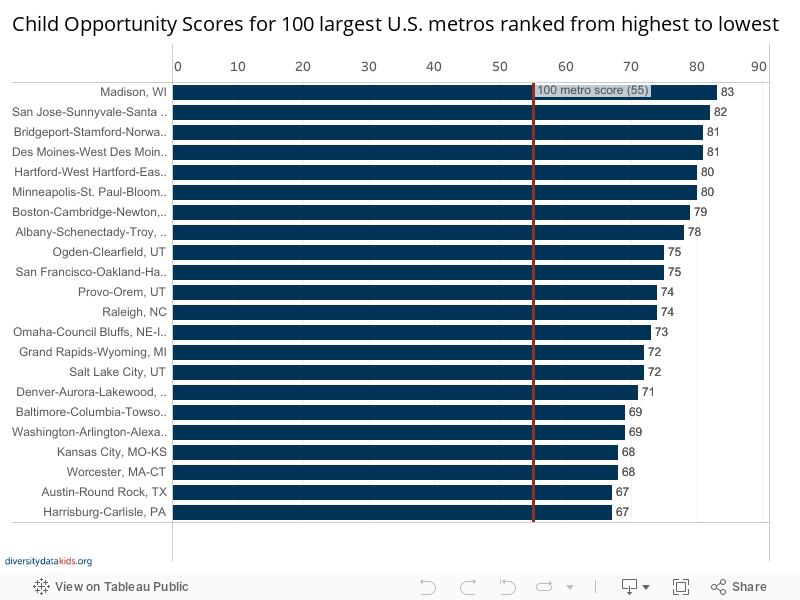

The chart below ranks the 100 largest metro areas from the highest to the lowest Child Opportunity Score. Hover over a blue bar to see how each metro’s Child Opportunity Score compares to the score for the 100 largest metros combined (55).
Distribution of children across opportunity levels
Child Opportunity Scores are one metric to quantify opportunity. Child Opportunity Levels are another, closely related metric that has proven highly effective for many users. After ranking all neighborhoods from low to high according to their Child Opportunity Index, we grouped them into five national opportunity levels (five equal groups each containing about 20% of the U.S. child population): very low-, low-, moderate-, high- and very high-opportunity neighborhoods. A child living in a very low-opportunity neighborhood faces some of the worst neighborhood conditions in the U.S., and conversely, a child living in a very high-opportunity neighborhood experiences some of the most favorable neighborhood conditions available to children.
The chart below shows the distribution of children across the five national opportunity levels for each of the 100 largest metros in the U.S. As you scroll down, notice the wide variability between metros in where children live across opportunity levels.
In Bakersfield, 51% of children live in very low opportunity neighborhoods, which means that half of all children living in Bakersfield live in neighborhoods that, by national standards, have the most limited conditions and resources for healthy child development. On the other hand, in San Jose, CA, 52% of children live in very high-opportunity neighborhoods by national standards.
In Milwaukee, kids live at the extremes—almost a third (29%) live in very low-opportunity neighborhoods by national standards, and 36% live in very high-opportunity neighborhoods. Just 10% of children live in the middle, in moderate-opportunity neighborhoods.
Read more about Bakersfield and Madison: Child opportunity at the extremes

Where children grow up matters
Regardless of where they live, children should experience conditions that allow them to reach their full potential. The neighborhoods in which they grow up strongly influence not only children’s experiences, health and education today, but also their opportunity to grow into healthy, productive adults. Because of the importance of neighborhoods for children’s experiences and healthy development, the Child Opportunity Index quantifies and maps neighborhood opportunity, creating a shared knowledge base for action. Policymakers, governments, community organizations, advocates and others can use the COI to understand and improve access to child opportunity, so that all children can enjoy neighborhoods that support healthy development.
""These are all our children. We will profit by, or pay for, whatever they become.""
Source: Child Opportunity Index 2.0 database, diversitydatakids.org.
Note: A data revision in June, 2020 has led to very small changes in datapoints/rankings for some individual metros. See the revisions and updates page for complete details.